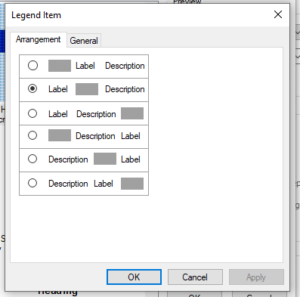
In lab 6, you are asked to add the area results to your map in both hectars and acres. You can insert the results via a graph or table (View -> Graphs -> Create Graphs). You can also edit the legend to add the information directly to your symbology.
- Go to the Symbology tab on the layer you would like to add the information to.
- Right click and go to “Edit Description” and add the results for that category.

- Now go to your legend properties.
- Select the item you want to edit and click “Style”.
- Select a style that includes the label and description. A good tip is to edit the look of the legend item by going to “Properties”.
- Select the arrangement that you want to see the label and description.

- When you are done you should have a legend that includes both the label and descriptor for each category.

