
Often when working on a project with team members who are non-GIS users, you may collect data in the form of an excel spread sheet. This spread sheet could look something the one included in our data. The idea is that somebody has gone out to designated points previously determined to be important as monitoring locations. These could be soil, water, chemical, air, rainfall, vegetative or wildlife sampling sites. The sites may have been located and their coordinates recorded from a GPS, but you only know the
location and the coordinates. The data provided to you is not in GIS format. We will learn how to import non-GIS excel data into a GIS and then save it as a feature class or a shapefile.
PART A) OPEN THE EXCEL SPREADSHEET AND LOOK AT THE DATA.
It will get added to ArcMap as GIS data exactly in the format that it is displayed as. Note!!! We must make sure that the field names are set up properly so that they will transition into GIS easily. Just the same as creating a new feature class, you must choose appropriate names for the fields. No Spaces, No special characters, no dashes are allowed. And it must not start with a number. Next is an X location field, and a Y_location field. These are the coordinates for the feature class and will serve to tell the GIS where the points are located.
- The x coordinate denotes the easting, which is the east to west coordinate
measurement. - The y coordinate denotes the northing, the north and south measurement.
Sometimes data can have errors and the person who provided you the spreadsheet might have miss-named the fields and put them backwards. You can tell what the X and Y are by their length, because the UTM zone is a maximum of 1,000,000 meters wide, the x coordinate will always be 6 digits long. The Y coordinate measures from the equator to the north pole so the value in Canada at least, will always be 7 digits long. You must be provided with meta-data that outlines what coordinate system or projection
the data is in because we will need to tell the GIS this when we import it. If you are not provided with this information, it becomes a guessing game. In this case, the data are projected in UTM Zone 12 N. Finally; notice that the measurement data is also included.
PART B) LOAD THE XY DATA INTO ARCGIS
We would like to add the spread sheet as a points layer to ArcGIS. When we do this the data will appear as a set of points. We will need to define its Projection or coordinate system at the same time. When we add the layer it will be stored only in temporary memory. In order to make it permanent, we will need to export it to a feature class. Once we have exported it to a feature class and it is permanent, we can edit it, or manipulate it in any way just as we would with any data. In order to do this here is an overview of the
steps we will take:
- Make sure ArcMap is open, and Data connections are set up to your workspace
folder. - Make sure the excel spreadsheet is closed (if you try to load excel in while its open,
you will get an error that the field is locked). - Add XY Data. Click File → Add Data → Add XY Data
The Add XY Data Dialog opens up:
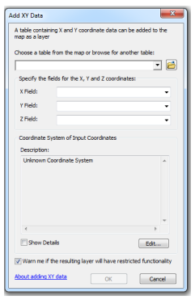 Click the Browse Button to Navigate to the location of the excel spreadsheet. Double click the excel spreadsheet. This will expand the spreadsheet workbook. In Excel there are many sheets in a workbook. The default page is sheet 1. This is where our data is stored. Click Sheet 1$.
Next fill in the X field and Y field dropdowns. Note that you can chose any field within the table to represent the X coordinate or Y coordinate. For the X field dropdown simply set it as X field. For the Y field dropdown, simply set it as Y field.
Keeping in mind that what it is asking for is the column in the table that represents the easting coordinate and the column that represents the northing coordinates. Ignore the Z field: this would be used if we had also collected a 3rd variable for each location such as elevation. In general, this is never used unless building some kind of GIS model.
Finally, at the bottom of the tool, you are asked to select the Coordinate system of inputs. This is where we will tell it what coordinate system, or projection to project the data in. Click “Edit” to open the dialog where we can select the projection or coordinate system. Find UTM NAD 1983 Zone 12 North Projection and select it. (Projected Coordinate Systems / UTM / NAD 1983 / NAD 1983 UTM 12N).
Once these are all selected, click OK. Take note of any error messages that appear. Have a look at the data. Does it look like it fits where it probably should? Does it make sense? Does it look like something is amiss?
PART C) EXPORT XY DATA TO MAKE PERMANENT
This entire process so far has been only a temporary process. We have imported the data, but it is not permanent. We need to export this data to create an actual GIS Feature class to edit it or share it. To export simply right click the points layer in the table of contents / data / export.
Save to the appropriate location.